

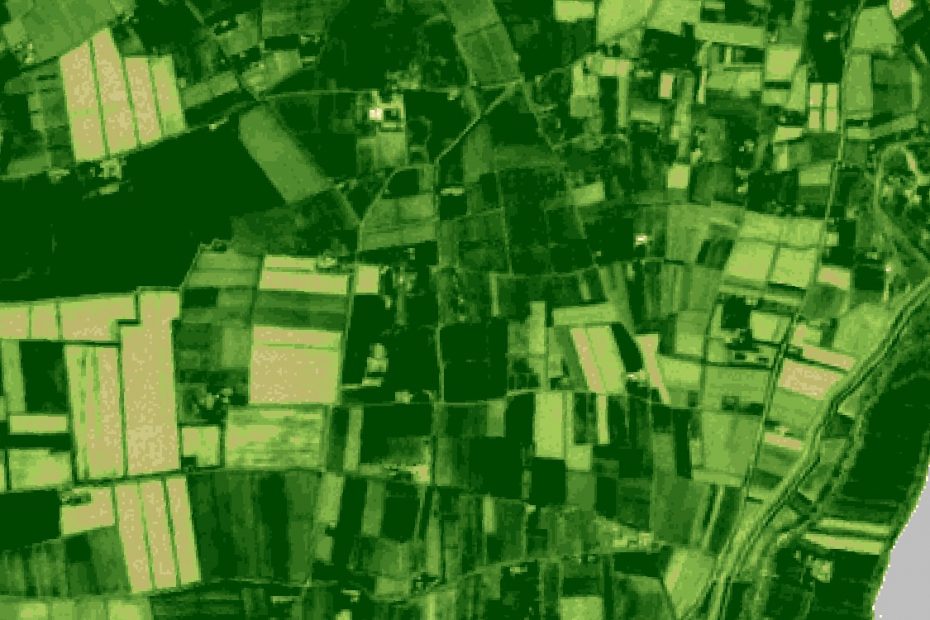
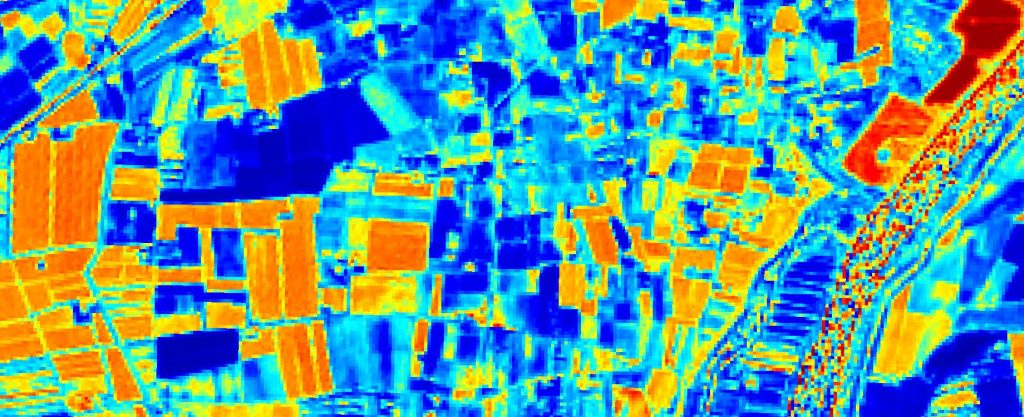
NDVI – Normalized Difference Vegetation Index
It tells us about the active biomass level of a field or crop.
We would discount non productive areas like roads, lakes, forests ( unless it is a food-forest) only to leave a “clean” polygon per field on which to calculate the mean and standard deviation ( what I currently call BioStat index).
The NDVI is the simplest and most effective all all indices, it is also comparable to other places as it has become the “standard” for biomass activity monitoring.
Also reasonably safe to compare between satellites and also provides the posibility of multi-temporal data to show how an area is responding to management.
Agriculture
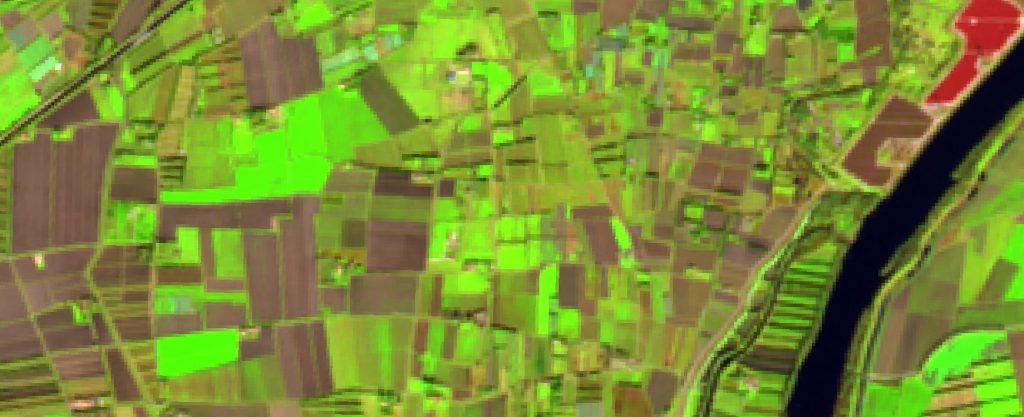
This band combination is useful for monitoring agricultural crops. In the image, bright green represents vigorous, healthy vegetation while non-crops, such as mature trees, appear in a dull green. Coniferous forests appear as a dark, rich green while deciduous forests appear as a bright green. Sparsely vegetated and bare areas appear brown and mauve.
Color Infrared
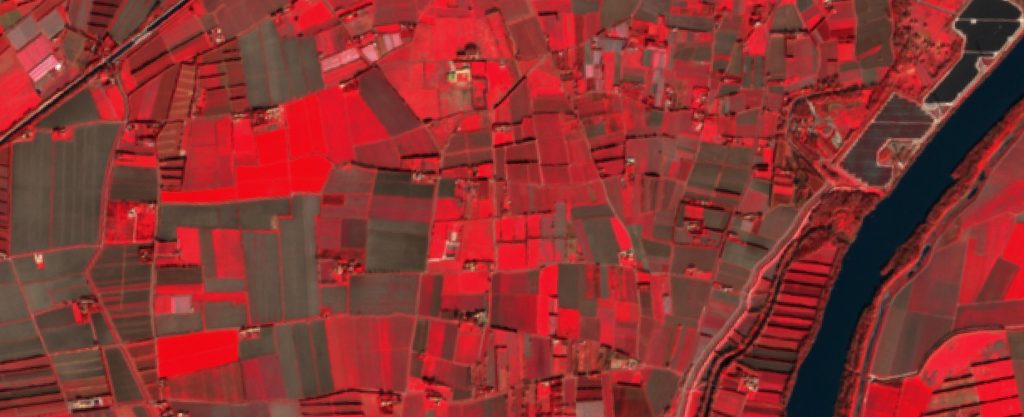
A standard “false color” composite. Vegetation appears in shades of red, urban areas in shades of blue. Useful for vegetation studies, monitoring drainage and soil patterns and various stages of crop growth.
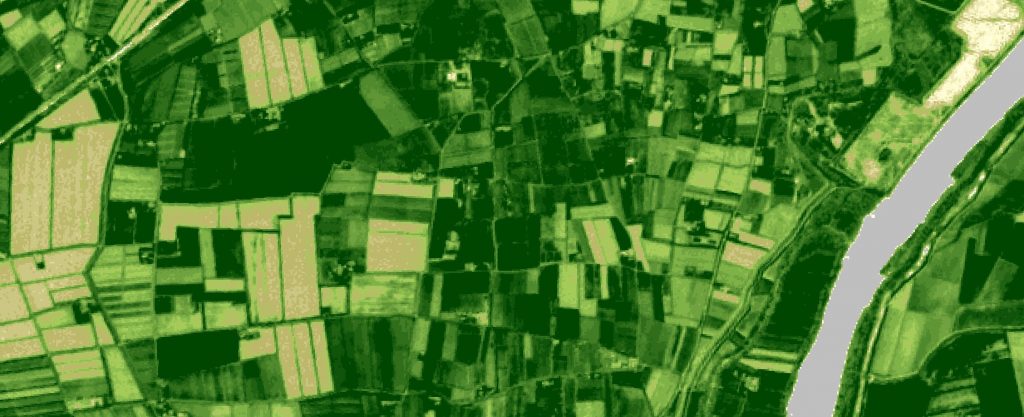
NDMI – Normalized Difference Moisture Index
Describes the crop’s water stress level.
Natural Color

Just like we see in reality with a combination of the Red, Green and Blue bands