A tool to understand and document your farms biomass vigor throughout the year
BioStat Base
Follow the biomass activity on your property
€
480 per year
Saves time by reducing the frequency of pasture walks and complements on the ground observations.
Provides objective data, that allows you to follow biomass vigour over time. Excellent for validating and improving management decisions as well as a proof for farm environmental plans and investors.
Designed as high resolution printable maps and tables, that allows the whole decision making team to participate at the grazing planning sessions.
Conveniently arrives in your email when available, allowing you to act upon it at your convenience
popular
Understanding the system
The BioStat service emails biomass cover data to you from images taken by satellites.
BioStat service comes from a large group of third party earth and environment observation satellites which fly in clusters and take images when passing over land.
These satellites fly over most of the earth day and night, the images that are useful to us are those during daylight hours and without cloud coverage.
These satellites have a range of sensors including those that capture data relating to the amount of biomass in a paddock.
Each of these sensors captures part of the visible and invisible bands of light.
Satellite data is then put through an algorithm that converts the combination of these bands and other filters into a BioStat reading for each point of data.
Readings are then combined to a per-paddock average and standard deviation leading to a better representation of each individual paddock’s cover.
BioStat readings will vary for different types of pasture combinations and crops, combining these values with on the ground information will lead to a better understanding of what is happening on the land.
Every time the satellite captures a clear image of your farm, you will receive a report. As weather conditions, including clouds, can restrict the satellite’s ability to get a clear image, the frequency of your reports will vary.
How the BioStat service works
BioStat takes samples from across the paddock excluding hedges, troughs and tree shelterbelts and averages the results.
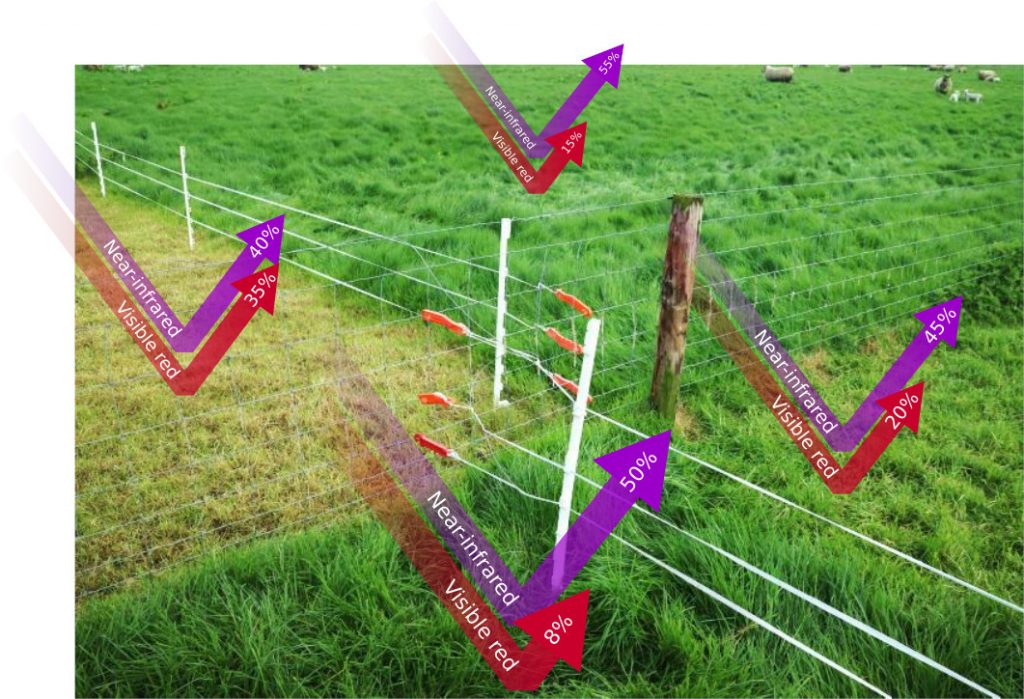
BioStat index is heavily based on NDVI ( Normalized Difference Vegetation Index)
NDVI measures plant health based on how it reflects light: healthy plants reflect a large amount of near-infrared light, unhealthy plants absorb more near-infrared light.
The resulting BioStat index from the calculation has a range from 0 to 10, with 0 representing no biomass like riverbeds, roads and erosion patches and 10 representing extreme biomass vigour.
Throughout the year, seasonal changes in the overall BioStat average will be evident, there will also be variations in values that depend on pasture management, weather and farm location.
Healthier pasture reflects more near-infrared light and less visible red light.
In the case of grazed or dry pasture the reflection of near-infrared and visible will approximate each other.
How to get the most out of BioStat reports
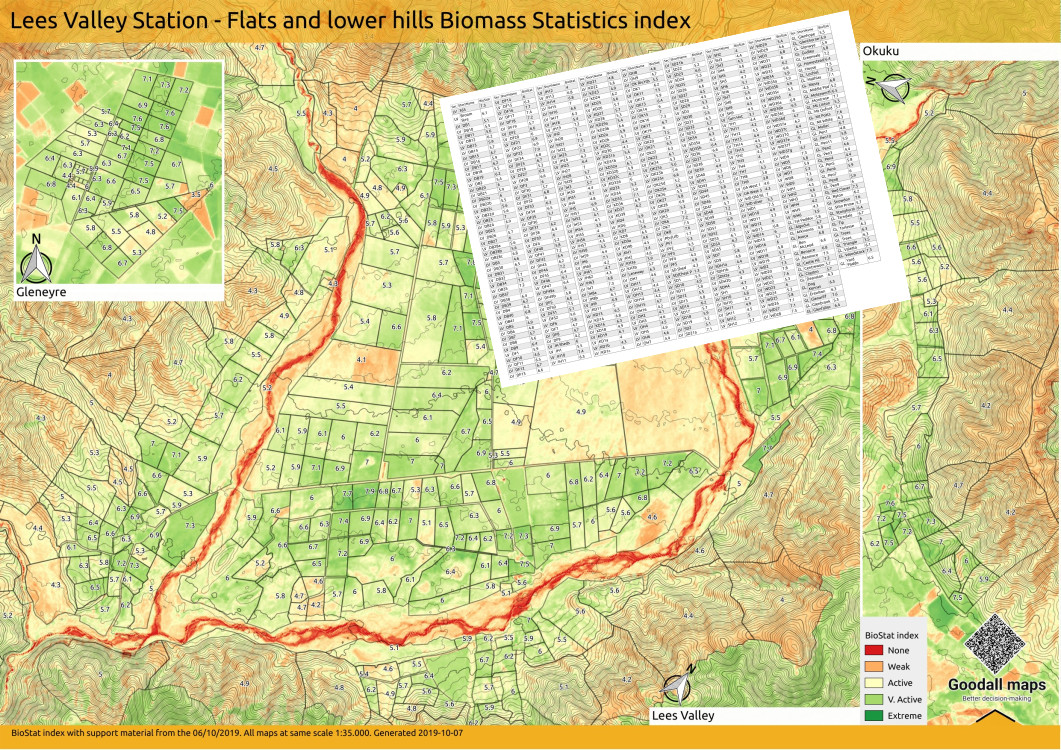
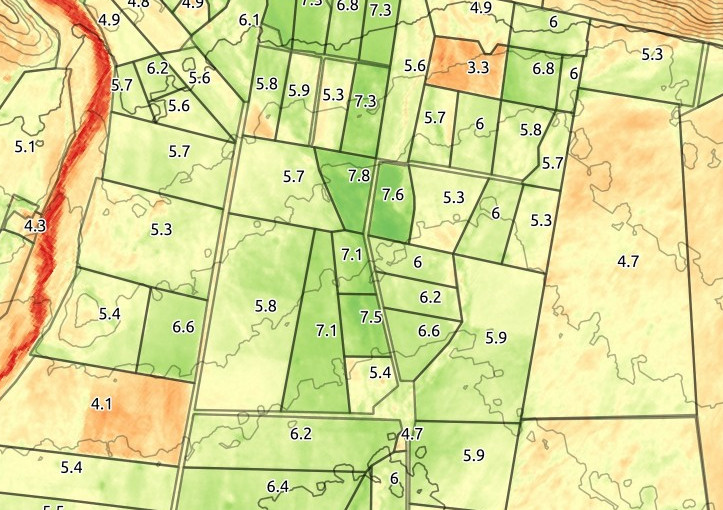
Pasture BioStat map
The map will show individual paddocks in a colour gradient ranging from red for no biomass activity, to yellow for an active biomass and green for extreme biomass activity. A label will accompany each paddock with their averaged BioStat index.
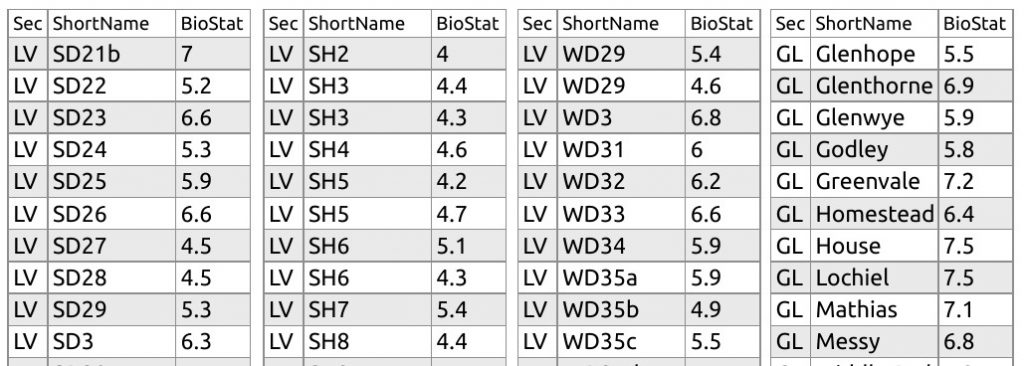
Paddock table
An alphabetically ordered table of all the sections and paddocks with the average BioStat value for the date stated at the foot of the map.
Report frequency
Reports are only sent if there is a clear image of the farm.
As weather conditions, including cloud and haze, and satellite positioning can restrict the satellite’s ability to get a clear image of your farm, the frequency of your reports will vary.
At the time the satellite passed over, your farm may have had clouds covering it resulting in an unusable report.
Some areas of the world have a very high frequency of cloud cover, in these spots the report might not be available for several months at a time.
Reports might be delayed for up to three days after the satellite has passed for processing reasons in the case the image needs to be overlooked manually.
If there is any doubt about the satellite data but we believe that it will still be of use to you for management purposes, the report will be sent and a note will be added.
Satellite image availability
Satellite images are often available but we do not still have control over the cloud cover and this affects the report frequency. We will produce a map whenever we consider there is a clean view of the property or when the clouds can be masked out leaving enough information to make it useful.
Details about data
Data variability might occur when you receive two reports within a short interval of time, you must remember that the satellite systems are measuring a complex, dynamic system and therefore some variation is to be expected.
Comparing reports between properties or farm blocks will give you a better idea of their strategic importance in your grazing plan.
Paddocks with different pasture compositions or crops will have different values that have to be taken into account when comparing their BioStat index values. Vigorous weed growth will also show a high value.
Images might be cut off at a certain level, this happens when the farm is on the edge of the satellite path, it should not happen regularly. We believe it is preferable to deliver the available, partial data rather than no data at all.